You posted the service time change, clipped a strong sermon moment, shared the women's Bible study signup, and answered comments on Facebook after work. Then someone asks, “How's social media doing?”
That's where most church teams get stuck. The platforms give you plenty of numbers, but not many answers. A spike in views can feel encouraging and still tell you nothing about whether people showed up, joined a group, asked for prayer, or took a next step in faith.
Generic social media analytics for nonprofits usually stop at awareness. Churches need more than that. You're not only tracking donations or impressions. You're trying to understand community participation, discipleship interest, volunteer response, and event follow-through. That's a different job.
Measuring What Matters in Ministry
Most church teams start with the easiest numbers to find. Likes. Follower count. Reach. Video views.
Those numbers aren't useless, but they're weak on their own. A reel can “perform” and still produce no real ministry outcome. A quiet post about baptism class or grief support can reach fewer people and still matter far more because it leads to conversations, registrations, and care.
Church-specific social media analytics for nonprofits should answer a simpler question: Did this post help someone take a meaningful next step?
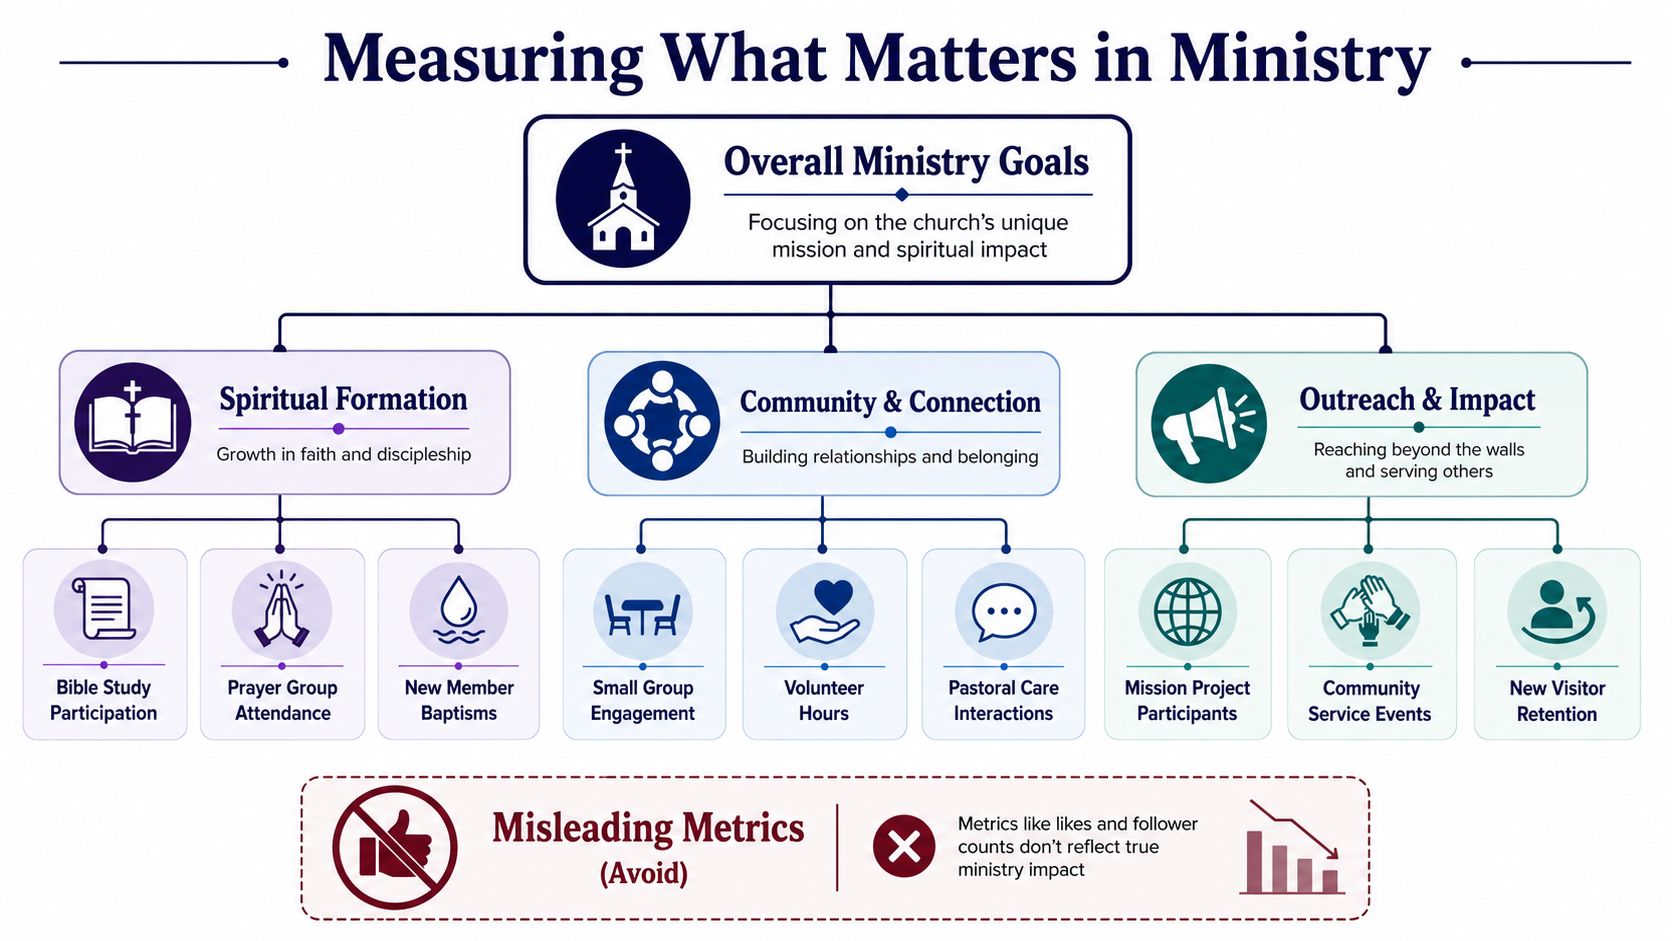
Replace vanity metrics with ministry signals
A healthy church dashboard usually tracks actions like these:
- Connection actions: plan-a-visit clicks, first-time guest form submissions, small group interest, direct messages asking for service details.
- Care actions: prayer requests, pastoral care inquiries, counseling form visits, comments that turn into follow-up.
- Participation actions: volunteer sign-ups, event registrations, class enrollments, sermon discussion replies.
These are the numbers leadership can use. They connect your social work to real ministry activity.
Practical rule: If a metric can't help your team make a ministry decision, it probably doesn't belong at the top of your report.
There's also a strong case for using clearer calls to action. Data shows that 42% of church social media users have donated to a nonprofit after seeing a post on social media, and posts with clear CTAs like Donate or Register see up to 3.5x higher engagement rates than passive content according to Kindsight's nonprofit social media strategy research. For churches, that means a post shouldn't just inspire. It should guide someone toward a next step when a next step is appropriate.
What this looks like in practice
A sermon clip about anxiety might not need a donation button. But it should probably point somewhere useful. That could be:
- A ministry page: support group, prayer request form, or counseling resource
- A discussion prompt: a comment question that helps people respond, not just scroll
- A follow-up path: a related devotional, message notes, or sign-up for a class
If you need a clearer baseline for how these measurements work, this guide on what social media analytics actually track for churches is a good starting point.
Church teams often assume social success means broad visibility. It doesn't. In ministry, success often looks smaller and deeper. Fewer people reached, more people helped. That's a better scoreboard.
Your Central Hub for Church Social Media
The hardest part of analytics usually isn't reading data. It's gathering it from too many places.
Facebook has one view. Instagram has another. YouTube tells a different story. Event details live in Planning Center. The volunteer handling social may also be running slides, answering texts, and fixing a broken livestream link five minutes before service.
Start with one operating view
A workable setup has one central hub for planning, publishing, and reviewing. That matters because church content is tied to a real ministry calendar, not a generic marketing schedule. Sunday sermons, student nights, VBS signups, holiday services, prayer gatherings, and serving opportunities all need to line up.
A simple setup process looks like this:
- Connect your social accounts so posting and reporting happen in one place.
- Sync your church calendar so upcoming events don't rely on someone remembering every date.
- Organize content by ministry type such as sermons, events, discipleship, care, and volunteer recruitment.
- Review weekly performance together so the team can spot what's driving attendance or response.
That's where a church-specific system helps. ChurchSocial.ai gives churches one visual place to plan posts, create sermon-based content, schedule across platforms, and manage a drag-and-drop calendar. It also integrates with Planning Center and other church calendars, which makes event-based content easier to keep current without rebuilding every post from scratch.
Reduce friction for volunteers
What usually breaks a church workflow isn't strategy. It's friction.
- Too many tools: one app for graphics, another for scheduling, another for notes, another for analytics
- Too many handoffs: pastor sends transcript late, volunteer edits clip manually, admin adds event link later
- Too little visibility: nobody knows which post supported which ministry outcome
When one system holds the calendar, content, and post history together, it becomes easier to answer basic questions fast. What did we publish this week? Which ministry got attention? Which event still needs promotion? Which sermon clips keep getting saved or shared?
A church social process should lower the volunteer burden, not add another reporting job.
That kind of clarity matters more than fancy dashboards. If your setup is too complicated for a busy volunteer to maintain, it won't last.
The Sermon-to-Social Analytics Workflow
A church already creates its most valuable content every week. It happens in the sermon.
The practical win is turning one message into a full week of social content, then measuring which parts move people to engage. That's more useful than posting random graphics just to stay active.
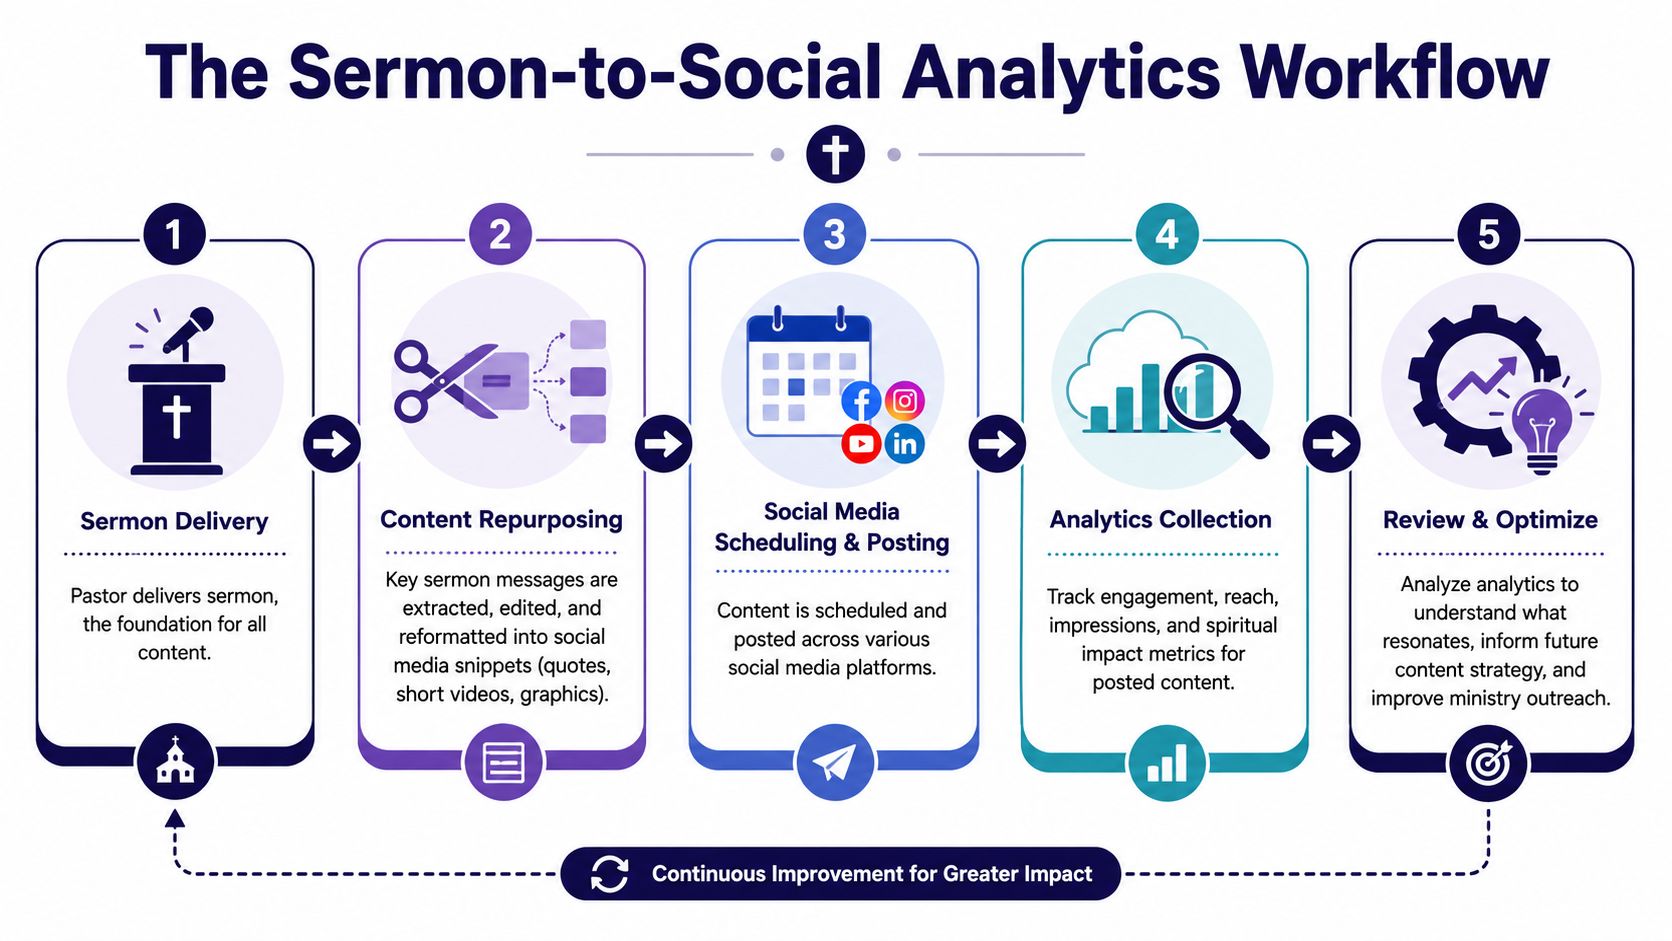
A repeatable weekly flow
Here's a clean workflow many church teams can sustain:
Capture the sermon source material
Start with the sermon video and transcript. A transcript matters because it gives you searchable language, cleaner quotes, and better short-form clips.Break the message into formats
Pull one main reel, two or three short quote posts, a carousel with key takeaways, and a blog recap from the same sermon.Schedule by audience intent
A reflective quote may work midweek. A direct invitation to respond may fit after service. Event tie-ins should sit close to the ministry moment they support.Track content by purpose
Don't compare every post the same way. A sermon reel and a volunteer signup post are trying to do different jobs.
If you need better subtitle quality before publishing clips, AI transcription for precise captions is worth reviewing. Clean captions improve comprehension and make sermon excerpts easier to follow with sound off.
Use content balance, not content pressure
Churches often slide into over-promotion. Every post becomes “join us,” “register now,” or “give today.” People tune that out fast.
A useful benchmark is the 70/20/10 Ratio. 70% of posts should be educational or inspiring, 20% community-focused, and only 10% promotional. Churches that go beyond that 10% promotional level can see a 40% decrease in click-through rates due to audience fatigue, based on these nonprofit social media benchmarks.
That ratio fits church ministry well because it mirrors how trust is built. Most of your content should help, encourage, teach, and connect. A smaller portion should ask for a direct action.
What to measure from each sermon
A sermon about forgiveness might produce several assets. Each one should have its own success test.
| Content piece | Primary question |
|---|---|
| Short reel | Did people watch and respond in comments or shares? |
| Quote graphic | Did it spark saves or meaningful replies? |
| Carousel | Did people move through the full teaching sequence? |
| Blog recap | Did it drive click-through to the website? |
| Small group prompt | Did it start discussion or group participation? |
Strong church content doesn't come from making more posts. It comes from making one sermon work harder across the week.
That's the workflow churches should keep refining. Not “What can we post today?” but “What did Sunday give us, and what did people respond to?”
Building a Dashboard Your Board Will Understand
The board meeting starts in ten minutes. A volunteer opens a report with reach, impressions, watch time, follower growth, and platform acronyms across six slides. The room gets quiet because nobody can tell what changed in ministry.
A board dashboard should answer a simpler question. Did your church's social content help more people take a meaningful next step?

That changes what belongs on the page.
Board members usually care about three things. Are more people engaging with the life of the church, which messages are resonating, and what should the team do next. Metrics only matter if they support one of those decisions. For churches, that means putting spiritual and community outcomes ahead of vanity numbers.
What to put on one page
A strong one-page dashboard covers four areas:
- Ministry outcomes: Plan a Visit clicks, event registrations, volunteer interest, prayer requests, direct messages, and small group inquiries.
- Content themes: Which topics drew response, such as parenting, grief, prayer, marriage, missions, or a sermon series theme.
- Channel summary: Which platforms helped people take the next step. Keep this short.
- Next action: One or two changes for the next month based on what you learned.
ChurchSocial.ai makes this easier because it is built around church reporting, not generic nonprofit dashboards. Instead of forcing your team to translate platform metrics into ministry language, it helps you track the signals church leaders ask about.
A board-friendly layout
Use an order that matches how leaders make decisions:
Top ministry outcomes
Start with the actions that show real participation. Registrations, volunteer sign-ups, prayer requests, Plan a Visit clicks, or replies asking for help.Top-performing ministry themes
Say what people responded to in plain language. Family discipleship. Anxiety and hope. Easter invitation. Local outreach.Platform contribution
Show which channels supported those outcomes. Avoid a long platform-by-platform breakdown unless the board asked for it.Recommended adjustment
End with a clear recommendation. Post sermon clips on Mondays instead of Tuesdays. Reduce event-only posts. Create more content around the topic that generated conversations.
Here is the test I use. If a board member can scan the page in two minutes and explain what happened, the dashboard is doing its job.
| Board doesn't need | Board does need |
|---|---|
| Reach totals for every post | Which content led to a next step |
| A dump of platform metrics | A summary of ministry response |
| Technical analytics labels | Plain-language trends |
| Ten charts | One clear decision |
Keep the story tied to ministry
Church analytics should sound like ministry, not marketing.
A useful summary might read like this: Family-focused sermon clips generated the strongest response this month, and event posts connected best when paired with a pastor video and a direct registration link. That gives leadership something they can act on.
If your team is still choosing a reporting setup, this roundup comparing the best social media analytics tools for churches shows what to look for in a platform and why church-specific reporting matters.
Short reports win. Clear reports get discussed. ChurchSocial.ai helps teams build both without turning a volunteer into a data analyst.
Turning Insights into Actionable Ministry
Monday morning, a volunteer opens last week's post results and sees three very different signals. A sermon clip drew thoughtful comments. The event post reached plenty of people but produced few sign-ups. A volunteer ask barely registered. The next question is the one that matters. What should the church do this week because of that?
Analytics only help ministry when they change a decision.

Church teams do not need more charts. They need a repeatable way to connect online response to church-specific outcomes like participation, conversations, registrations, prayer requests, and next-step engagement. Generic nonprofit reporting rarely goes far enough here. ChurchSocial.ai is built around that ministry workflow, so a volunteer can see what happened and decide what to change without stitching together five tools.
Turn signals into next steps
A useful review ends with a ministry action, not a platform summary.
Use simple rules your team can apply every week:
- If a sermon clip starts real conversation, then turn that theme into a follow-up question, devotional, or small group discussion prompt.
- If an event post gets attention but few registrations, then check the call to action, the registration page, and how early the invitation was posted.
- If volunteer recruitment posts stall, then lead with the ministry impact and the role clarity before asking for a sign-up.
- If care-focused posts are saved and shared, then create more practical content around that need, such as prayer resources, family guides, or pastoral follow-up.
That kind of rule set keeps a church from reacting emotionally to every spike or dip. It also helps volunteers make solid decisions without needing a marketing background.
Timing affects response
Posting time changes ministry outcomes because timing affects whether people can still act.
48in48's guidance on nonprofit social media timing notes that earlier event promotion often drives stronger response than last-minute posting. Churches usually see the same pattern. If the first clear invitation appears too late, people may appreciate the post and still miss the event.
A practical church rhythm often looks like this:
- Midweek: introduce the event and explain why it matters
- Day before: publish the clearest invitation with the registration link
- Day of: share reminder details like time, parking, kids check-in, and what to expect
Strong content still underperforms when people see it after they have already made other plans.
Match the metric to the ministry move
The same low-performing post can point to very different problems. Creative is only one possibility. Sometimes the topic connected, but the next step was unclear. Sometimes the post was fine, but the sign-up path had too much friction. Sometimes the response happened offline, which is common in churches and easy to miss in generic nonprofit dashboards.
| Signal you notice | Likely issue | Ministry response |
|---|---|---|
| High reach, low clicks | Invitation is weak or posted too late | Rewrite the ask and publish earlier |
| Strong video views, low follow-up | Topic connected, next step is unclear | Add one clear response prompt or link |
| Many comments, few registrations | Interest is present, path is clunky | Simplify sign-up and restate who it is for |
| Good attendance, low online response | People responded through other channels | Track offline follow-through alongside social |
For churches that want a clearer way to connect online activity with actual next steps, this guide on measuring social media ROI for ministry outcomes gives a practical framework.
The goal is not better-looking reports. The goal is helping more people take a next step, and knowing which content supported that step. That is the difference between watching metrics and using them for ministry.
Answering Your Church Analytics Questions
Most church volunteers don't ask whether analytics matter. They ask whether they can realistically keep up with them.
That's the right question. Social media analytics for nonprofits often sound like a full-time marketing function. In a church, it's usually one staff member, one volunteer, or a small team doing five other jobs.
How do I know if a post actually resonated
Don't assume a viral clip means strong ministry impact. Research indicates that 74% of small church volunteers misinterpret algorithmic spikes because they lack sentiment analysis, which leads to skewed content strategy, as discussed in this piece on nonprofit data analytics.
A simple test helps:
- Read the comments closely: are people responding to the message, tagging friends, asking questions, or sharing personal stories?
- Compare with follow-up actions: did traffic, registrations, or messages rise after the post?
- Check consistency: did similar themes work again later, or was it a one-time spike?
If the only result was inflated reach, be careful. Distribution isn't the same as connection.
Can one volunteer handle this
Yes, if the workflow is narrow and repeatable.
A volunteer usually does fine when the church limits the reporting task to a short weekly check and a simple monthly summary. Problems start when the team expects custom graphics, manual clipping, platform-native posting, comment moderation, event promotion, and detailed reporting with no shared system.
What works is a rhythm like this:
- Weekly review: check top posts, response patterns, and event clicks.
- Monthly report: summarize ministry outcomes for leadership.
- Quarterly adjustment: revise content mix based on what the church community is responding to.
How do I report bad news to leadership
Don't hide it, and don't dramatize it.
If reach drops, say so plainly. Then tie it to something useful. Maybe the content mix became too promotional. Maybe event posts were late. Maybe the team published less consistently because volunteers were stretched thin.
A constructive report doesn't say, “Social media is down.” It says, “Response dropped, here's the likely reason, and here's what we're changing.”
That approach builds trust. It also shows leadership that analytics aren't about defending the channel. They're about improving ministry decisions.
If your church wants one place to turn sermons into reels, generate posts and blogs from transcripts, design graphics and carousels, manage a drag-and-drop calendar, and keep event content aligned with Planning Center, take a look at ChurchSocial.ai. It's built around the workflow churches already have, which makes analytics easier to connect to ministry outcomes instead of just platform metrics.